Undoubtedly, you have seen and probably read countless books on the importance of strategy in your organization. I cannot add anymore to the discourse, but I would like to share some insights, both as an entrepreneurial leader and as a former corporate employee.
First, I am as guilty as anyone in allowing the mission critical activities of my clients and my own organization to crowd out the time spent on strategic visioning. I used to set aside Fridays for marketing, Public Relations and Visioning activities. Slowly, over time, the Fridays have become just another mission critical or problem solving work day. I’m working to reverse this trend.
I can’t provide any more persuasive reasons to create a balance between mission critical and strategic visioning than what is in the thousands of books, magazines, academic papers and blogs; but I can tell you that strategic visioning is what keeps entrepreneurs nimble, flexible, and able to take advantage of small windows of opportunity. Too much strategy and not enough “paid work” leaves you broke and making short-sighted decisions based on financial outcomes. Too much mission critical and not enough strategic visioning allows a competitor or even a whole new market to emerge that you didn’t see coming and possibly even worse, a lack of strategic direction keeps you from seeing your clients’ / customers’ needs which could lead them to more comprehensive solutions elsewhere.
There are plenty of guidelines of how strategic vision gets transformed into the everyday actions of employees and partners. I’d like to quickly focus on the role of metrics and how they can be the link between the vision and the everyday action. As an example, you are a CxO of your organization that develops and sells homes. One agreed upon organizational goal is to focus on the five most profitable floorplans at each development. A good number of builders and developers cannot tell you which floorplan, of those used across multiple properties, is most readily “accepted” by the market. Yet on the “front-end” they engage consultants to tell them what the market likes and what trends are likely to continue. If you were to ask Ford or Toyota which of their models was the best selling, they could tell you with specificity, down to the census block track and overlay data relating to the color of the vehicle as well as the demographics of that population.
In CRE, post mortems are usually only done when “there is a problem.” That is one of the reasons we prefer the phrase, “lessons learned.” Post mortems, imply by definition, that something bad has happened and that those doing the post mortem have some hypothesis of why. Lessons learned; however, has a slightly more neutral implication. We try to follow the data first, before forming conclusions as to why. Regardless, we digressed.
If you have not been tracking sales nor the various other factors that influence profitability of the project, how do you begin to understand which floorplans to focus your marketing and sales efforts on? The key is to have flexible metrics that will be useful across developments but also geographic regions and time.
Another key factor, which in many cases acts as a fast spreading virus that eventually kills the desire to measure, analyze, and react is the lack of systems to efficiently and accurately collect the data needed for the strategic metric; sales people do not collect demographic data of prospects; construction personnel don’t provide actual costs but provide average costs across all floorplan types, accounting systems are not flexible enough to track and report exceptions; it can go on and on.
These highlights are not the forum to provide all of the solutions to those challenges mentioned above, but above illustrates how hard it can be to institute the processes required to get a handle on company specific metrics & ultimately realize the strategic vision.
As an organization, we’ve been discussing the need for more strategic visioning and its requisite metric gathering and analysis with current clients. The initial conversations have been informative and positive. As a result, LDG Consulting made a strategic decision to form CRE insight, LLC (a wholly owned subsidiary) to operate in the following main areas:
- Assisting clients in leveraging their development and construction data as a means of providing insight and direction for future projects,
- Assisting clients in proactively determining potential project sites that simultaneously meet a varied host of customized requirements,
- Utilization of leasing data to help inform more efficient targeting of potential residents and a more effective use of marketing dollars, and
- Utilization of operational data to help inform better processes and better programmatic design of future projects.

Stay tuned for further announcements on CRE insight.
By now, you’ve probably realized that this blog entry is our lengthiest-to-date. That could speak to our sub-conscious desire to make up for lost time or it could reveal our passion for helping others look beyond the trees to the forest while simultaneously analyzing the petals on the wild flowers.
Data Visualization
Fortune Magazine’s Fortune 500 issue came out May 21, 2012. We thought we’d highlight a few things for you that we saw.
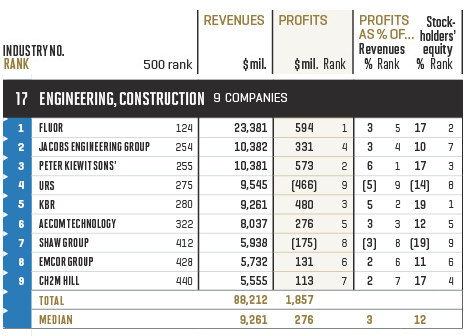
In addition to providing a list of the Top 500 Companies, they also sort and parse the data a number of ways, including sorting by Industries. Two industry segments we thought you might find interesting are:
Industry Sector: Engineering, Construction

Fortune 500 – Industry: Engineering, Construction
http://money.cnn.com/magazines/fortune/fortune500/2012/industries/144/
You can read the remainder at our previous blog post by clicking here.
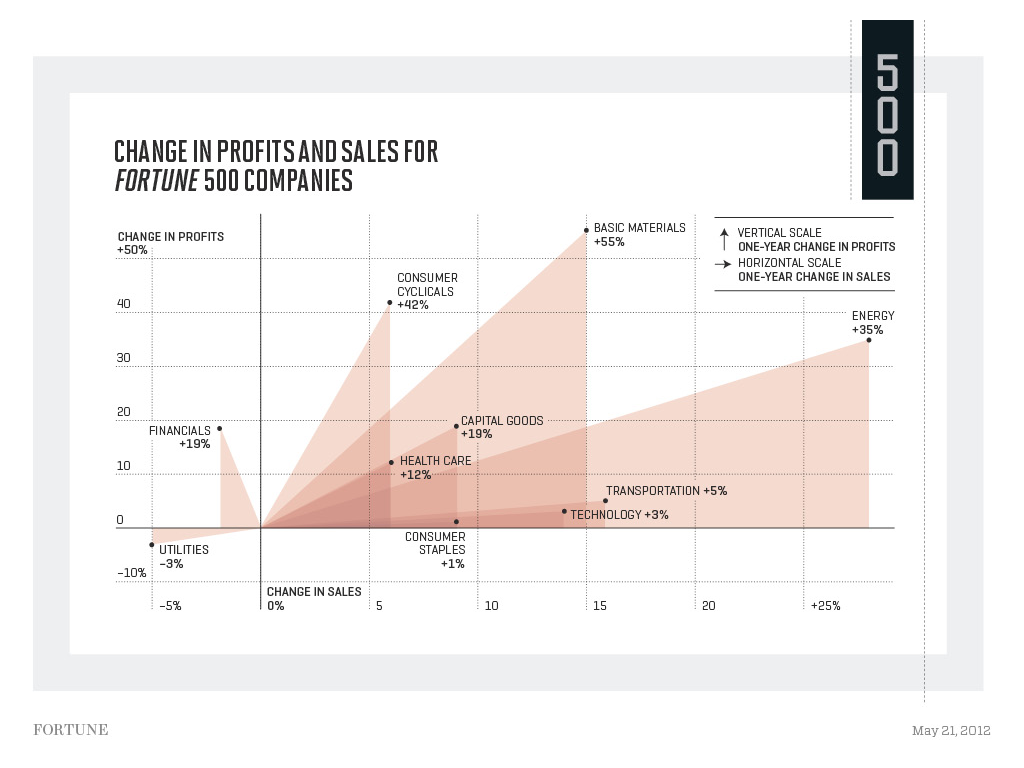
We found the chart below to be interesting
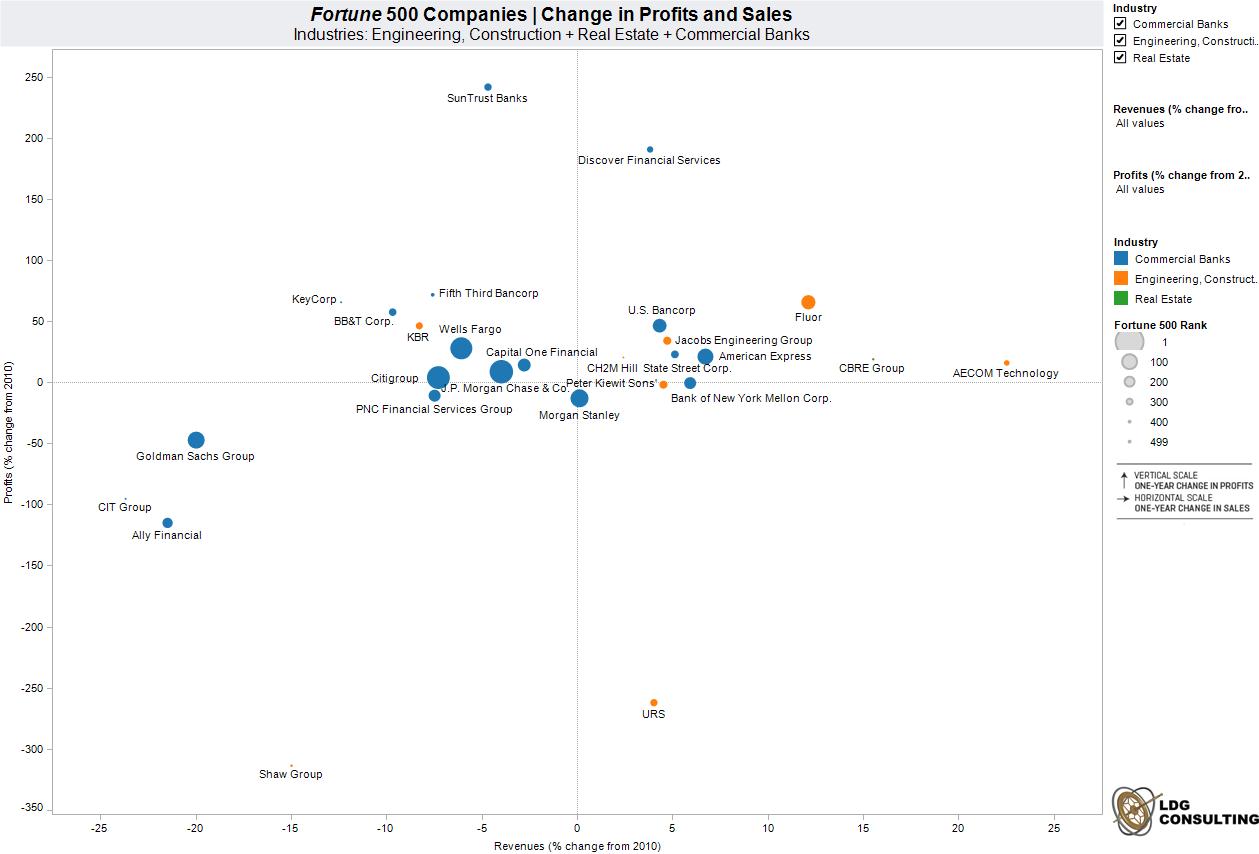
But we wondered what one would look like that compared the industry sectors above, so here’s the one we built:

Fortune 500 Companies | Change in Profits and Sales Industries: Engineering, Construction + Real Estate + Commercial Banks
Click here for the interactive version.
As you can see, the Real Estate industry is dwarfed by the Commercial Banks (actually it is hard to see CBRE Group).
So what does the chart tell us? Among many other narratives, only nine companies were able to have positive revenue and positive profit in 2011. That’s a little daunting, wouldn’t you say?


Leave A Comment
You must be logged in to post a comment.